Start exploring
You can use the search bar to explore the network-
Node and API tabs will show where an event has propagated after clicking on the “Network response” button. Nodes / APIs that are missing events will be highlighted in red ❗️ , partially missing data will be highlighted in yellow ⚠️ and fully synced will be green ✅

-
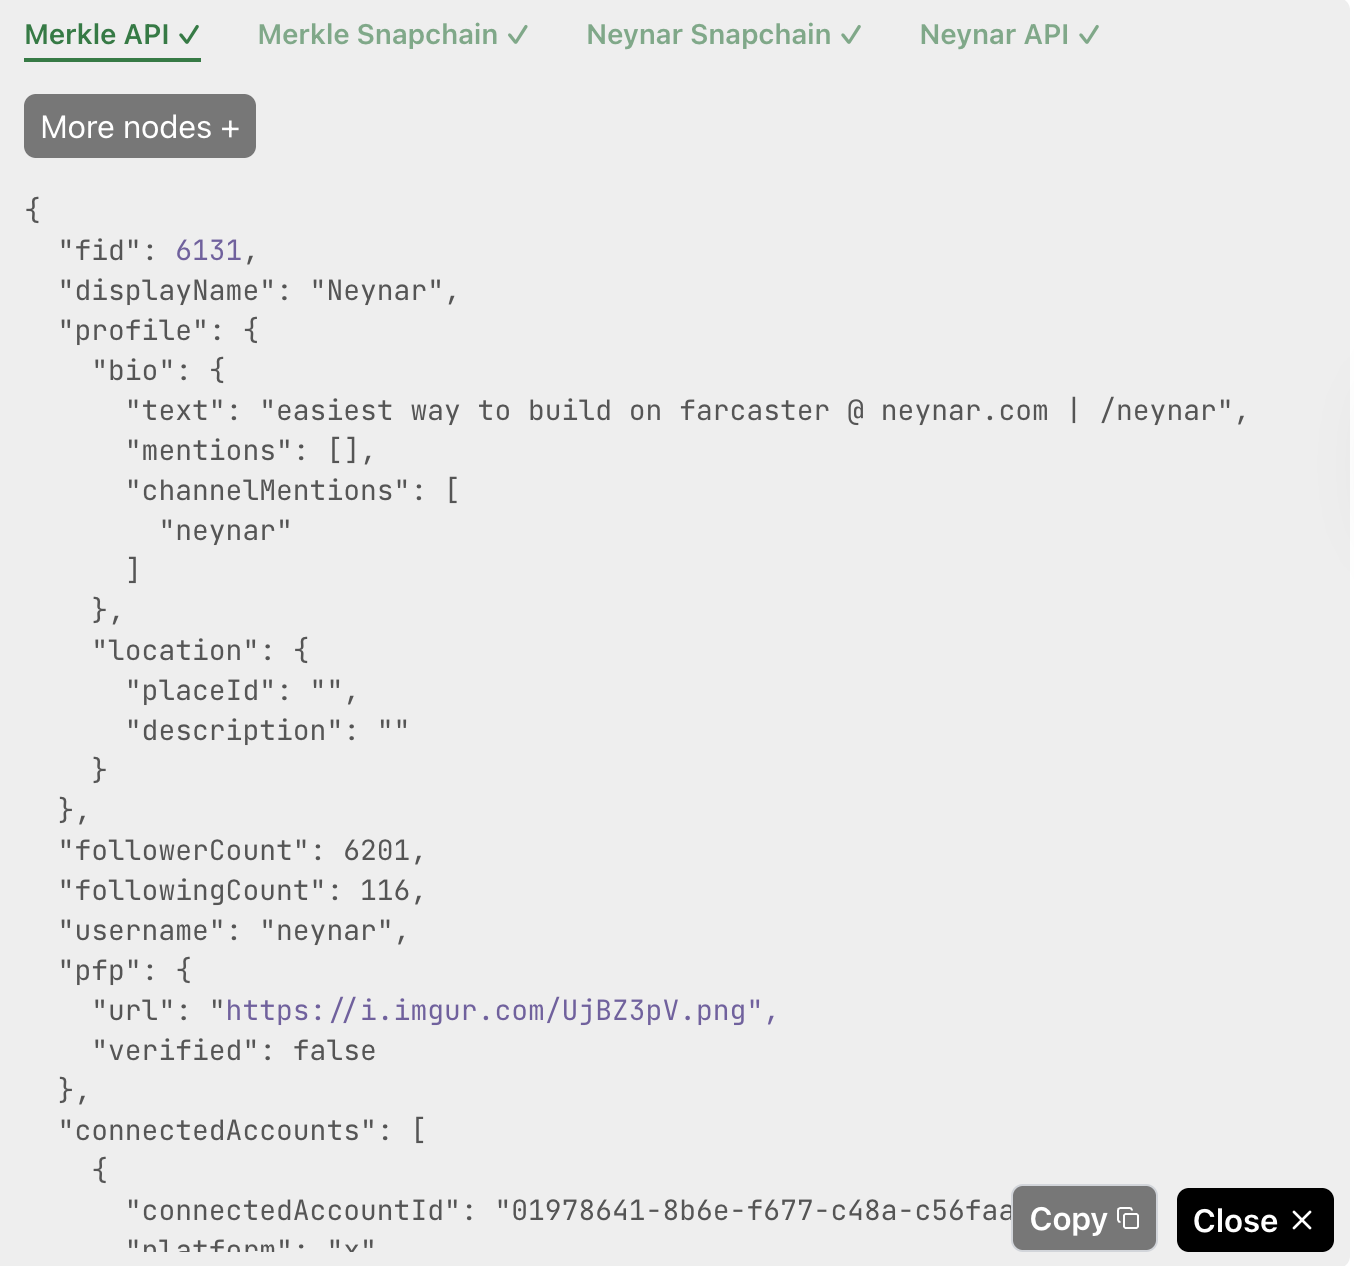
Clicking on a tab opens more details, allowing you to compare objects across nodes and APIs.
Things you can explore
- Specific casts: e.g.
0x1a37442d0bd166806b6bc3a780bdb51f94d96fad(cast hash) orhttps://warpcast.com/v/0xf809724b - Specific users: e.g.
194(user’s fid) - Cast search with keywords: e.g.
$higher- this will also show metrics of how often that keyword has appeared on the network recently
- results can be filtered by
username(cast author),channel_id(channel of cast) - results can be sorted by
desc_chronoralgorithmic - search mode can be changed between
literal,semanticorhybrid - read more about our cast search API, tap “Network response” to see event propagation for any cast
- User search with usernames: e.g.
rish- read more about our user search API, tap “Network response” to see event propagation for any user
- Follow relationships: e.g.
194<>191to see relationship between two FIDs - Feed API results: e.g.
https://api.neynar.com/v2/farcaster/feed/trending?limit=10&time_window=24h&provider=neynar- put any Feed API url from Neynar docs and evaluate results in a feed like format before you build a feed client
- see our Feed APIs